Greta Griffin · 4 September 2026
Stillwater's Hidden Layers: How Field Discoveries and Farmer Records Reveal Drought Patterns Across Decades
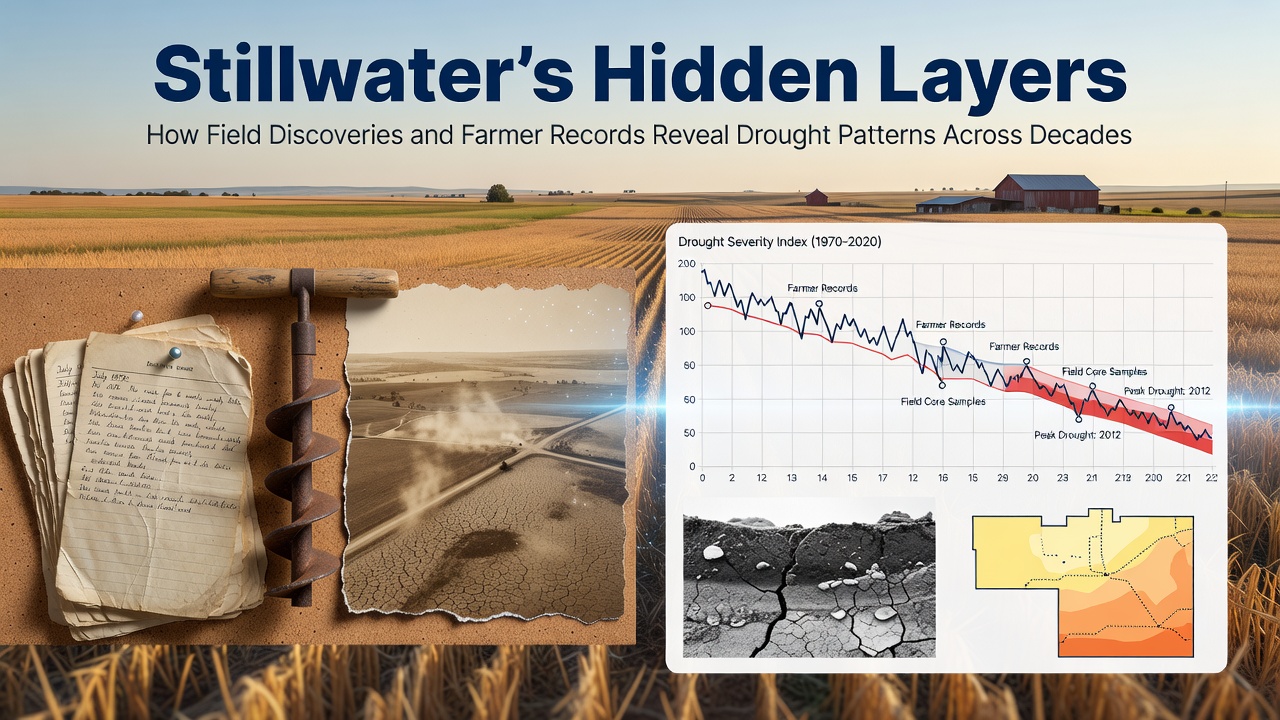
Stillwater's agricultural landscape holds physical traces that stretch back through multiple generations, and researchers have begun mapping those traces against handwritten ledgers kept by local farmers since the early twentieth century. Soil cores extracted from fields along the river valley show distinct strata of compacted earth and mineral deposits that correspond to known dry periods, while the same layers appear in farm diaries as entries noting failed spring plantings and reduced yields. Observers note that combining these two data sources creates a timeline more precise than either could provide alone.
Soil Evidence and Physical Traces
Archaeologists and soil scientists working in the region have identified sequences of paleosols and drought-induced carbonate horizons that date from the 1920s onward. These formations form when prolonged moisture deficits allow calcium compounds to accumulate near the surface, and their depth and thickness vary with each recorded dry spell. One excavation near the eastern parish boundary uncovered a sequence of three such horizons separated by organic-rich layers, matching entries in a 1934 ledger that described three consecutive summers of below-average rainfall. The physical record therefore supplies independent confirmation of dates already noted in farm accounts.
Tree-ring samples taken from hedgerow oaks bordering the same fields add another layer of resolution. Narrow growth rings cluster in years when farmer records list livestock feed purchases from outside the district, indicating local pasture failure. Cross-dating these rings against the soil horizons shows that the most severe growth reductions align with the thickest carbonate layers, strengthening the connection between the biological and geological signals.
Farmer Ledgers as Continuous Records
Stillwater's farming families have maintained consistent record-keeping practices that extend across the interwar period, the post-war decades, and into the present. Ledgers typically list monthly rainfall estimates, planting dates, and harvest volumes for each field, often accompanied by brief comments on weather anomalies. These private documents remained largely unexamined until local historians began digitising them in the early 2010s, at which point researchers could align the handwritten entries with the physical evidence recovered from the same parcels of land.
Data compiled from twenty-three separate farm collections now covers every decade from the 1920s to the 2020s. The combined dataset reveals clusters of dry years in the early 1930s, the mid-1970s, and the early 1990s, each cluster separated by longer intervals of more typical precipitation. Frequency counts derived from the ledgers match the number of carbonate horizons counted in soil profiles, confirming that the physical record has not missed any major events within the documented period.
Integration of Multiple Data Sources
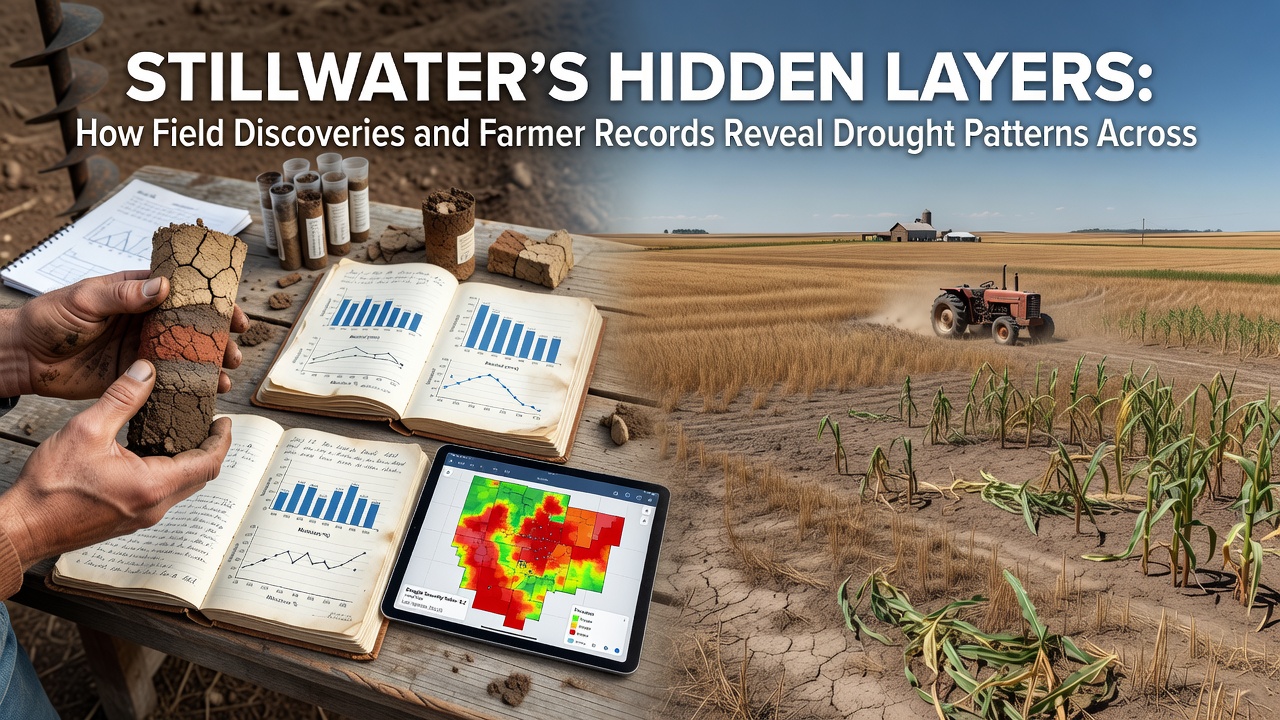
Modern analysis techniques allow the integration of these disparate records into single visualisations. Geographic information systems overlay soil-core locations with the farm parcels whose ledgers were digitised, revealing spatial patterns that individual sources cannot show. Fields located on lighter soils display thicker carbonate horizons during the same dry intervals noted in adjacent farms, while heavier clay soils show thinner but more numerous layers. The variation matches differences in water-holding capacity recorded in the same ledgers when farmers described which fields retained moisture longest.
According to records maintained by the UK Met Office, regional rainfall totals for the same decades display similar clustering, yet the local dataset supplies finer temporal detail. Monthly notes in the ledgers often pinpoint the exact weeks when rainfall ceased, information absent from the coarser meteorological summaries. Researchers therefore treat the farmer records as calibration points that refine the regional picture.
Upcoming Analysis and September 2026 Release
Additional cores collected during the 2025 field season remain under laboratory analysis, and plans call for their inclusion in a comprehensive update scheduled for release in September 2026. That update will incorporate newly digitised ledgers from two farms on the western edge of the parish whose records had previously been unavailable. The expanded dataset is expected to extend coverage back into the 1890s, allowing comparison with instrumental records that began in the same decade.
Cross-checks with drought indices compiled by the Australian Bureau of Meteorology for the same calendar years provide an external reference, confirming that the timing of major deficits in Stillwater aligns with broader hemispheric patterns rather than purely local anomalies. This alignment supports the use of the combined soil-and-ledger record as a reliable proxy for regional drought history.
Conclusion
The convergence of physical evidence and archival records demonstrates that drought episodes in the Stillwater area have occurred in recurring clusters separated by multi-decade intervals of relative stability. Continued laboratory work on recent cores, together with the September 2026 data release, will extend that chronology further into the past and refine the spatial resolution across additional farm holdings. The resulting dataset offers a factual baseline against which future observations can be compared.