Alex Neumann · 30 October 2026
Mapping the Wild: How Ongoing Surveys Guide Land Decisions in Village Woodlands
Survey teams continue to document tree cover, understory plants and wildlife corridors across village woodlands, and these records feed directly into local authority decisions on land allocation and conservation priorities. Data gathered through repeated field visits and remote sensing tools show changes in species distribution and soil conditions over time, while planners use the resulting maps to assess which areas require protection during development reviews.
Survey Methods in Practice
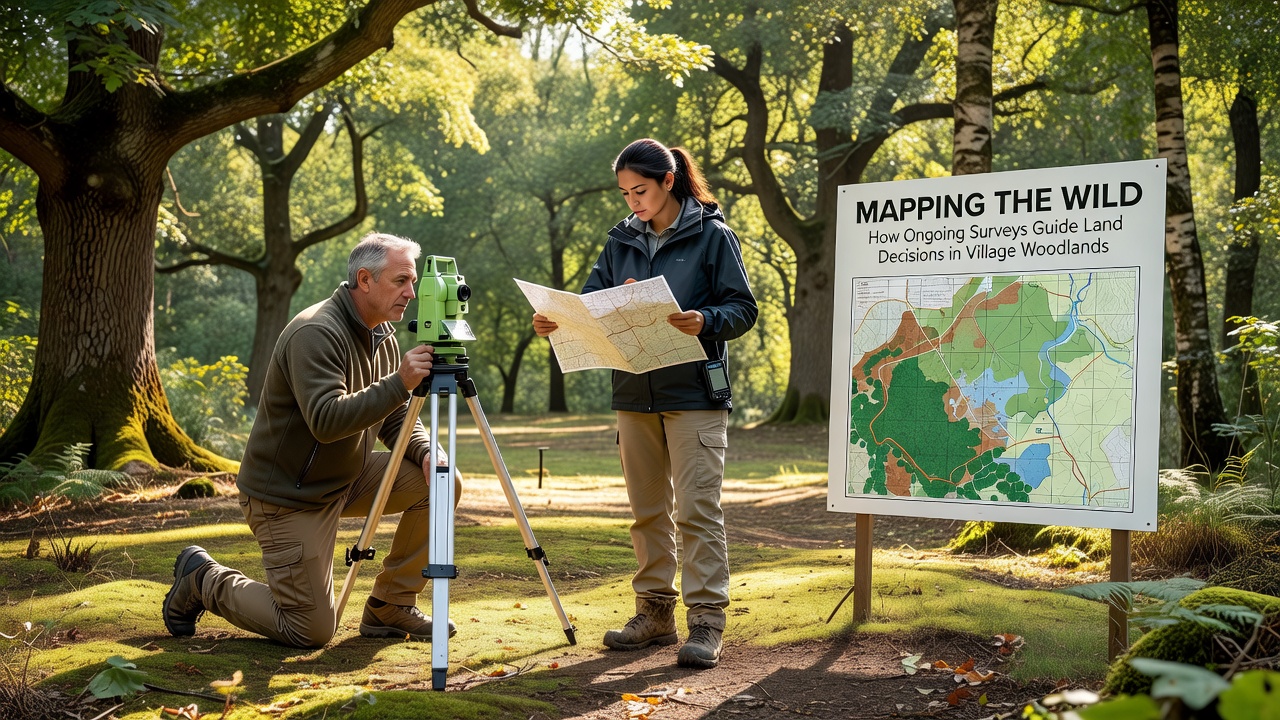
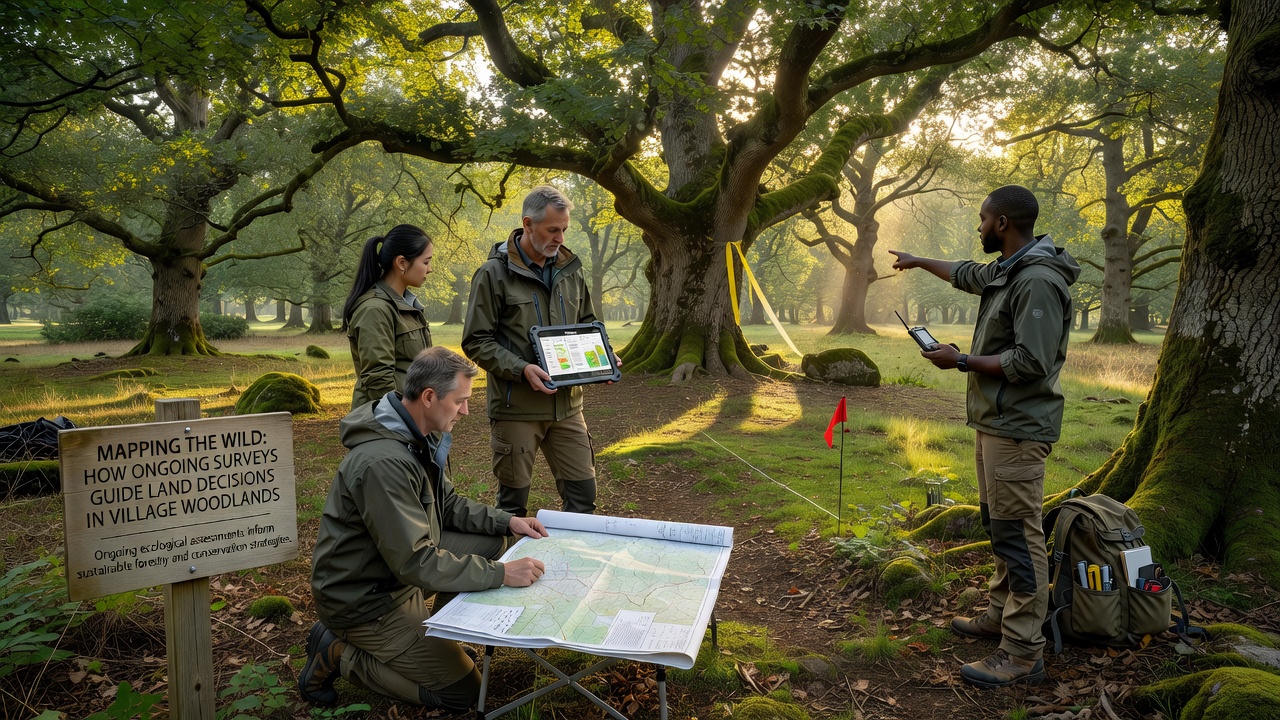
Teams record species counts at fixed plots every season, and they combine these counts with satellite imagery to track canopy density across multiple hectares. GPS units mark boundaries of ancient woodland remnants, while soil samples reveal nutrient levels that influence decisions on grazing or replanting schemes. Researchers cross-reference findings with historical maps held by parish councils, and this layered approach produces updated habitat classifications that local committees consult before approving infrastructure projects.
Drone flights capture high-resolution images twice a year, and software stitches the frames into three-dimensional models that highlight erosion risks along woodland edges. Observers note that these models help identify zones where footpaths need rerouting to reduce compaction, and the same data sets inform applications for grants under national woodland improvement programmes.
Integration with Planning Processes
Council officers review survey reports when evaluating planning applications near village woodlands, and they apply the mapped sensitivity ratings to set buffer zones that limit building footprints. Figures from recent assessments indicate that areas flagged for high biodiversity value receive stricter conditions, whereas lower-sensitivity zones may allow limited access improvements. This process ensures that decisions rest on measurable indicators rather than anecdotal reports.
As of October 2026, updated survey cycles are scheduled to cover additional woodland parcels that border expanding residential zones, and preliminary data already suggest shifts in bird nesting patterns linked to changes in adjacent farmland management. Planners incorporate these updates into the next iteration of the local development framework, which guides long-term land-use allocations.
Case Examples from Comparable Regions
One study in a comparable rural setting revealed that consistent monitoring allowed authorities to adjust felling licences in response to sudden declines in certain moth populations, and similar protocols now operate in several English parishes. Another project tracked veteran tree locations over five years, and the resulting register helped secure funding for protective fencing that reduced livestock damage by measurable margins. Those outcomes demonstrate how repeated surveys translate into concrete management actions.
According to reports from the Forestry Commission, integrated mapping programmes have supported more precise targeting of restoration funds across fragmented woodland patches. Data released by the US Forest Service shows parallel benefits in North American village-scale woodlots, where survey-driven plans reduced unauthorised clearing incidents. Observers note that the shared methodology relies on standardised recording sheets and open-access databases that multiple stakeholders can query.
Technology and Data Sharing
Digital platforms store survey layers so that parish councils, wildlife groups and landowners access the same base maps without duplication of effort. Updates occur quarterly, and version control prevents conflicts when new observations arrive from volunteer recorders. This shared resource shortens the time between field collection and policy application, and it allows rapid responses when invasive species appear in previously unrecorded locations.
Training workshops teach local volunteers how to upload sightings through mobile apps, and the aggregated records improve the resolution of habitat models used by consultants during environmental impact assessments. The result is a living dataset that evolves with each season rather than remaining static between formal reviews.
Conclusion
Ongoing woodland surveys supply the factual foundation for land decisions that balance development needs with habitat retention. Mapped outputs guide buffer designations, grant allocations and access management, while technology and community input keep the information current. As new cycles complete in October 2026 and beyond, the accumulated records continue to shape practical choices in village settings.